Preparation
Objective
In this chapter, we are going to evaluate different performance optimizations. It is therefore essential to understand how the current application performs to measure the impact of the optimizations.
Prerequisites
1. Getting the current image size
The image size is one of the most important factors to consider when investigating containerized environments. It plays a key role as the image needs to be downloaded and started by the container orchestration service.
Go to the Amazon ECR console.
Check the current container image size:
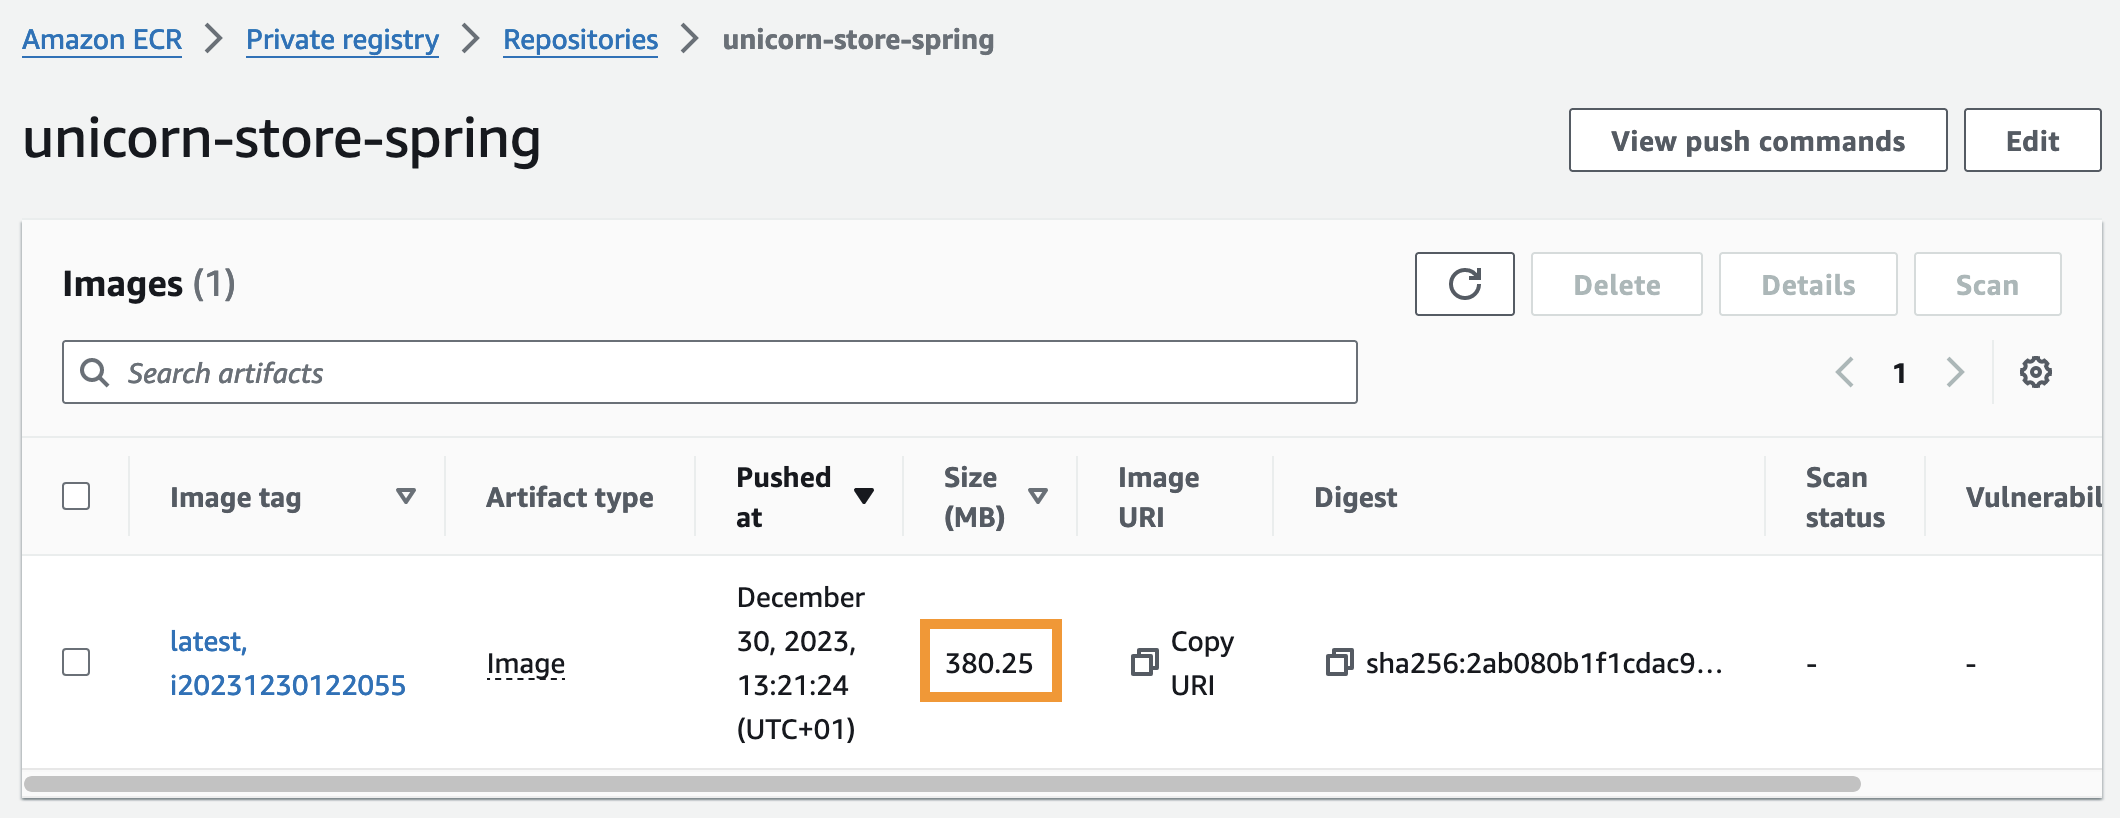
As we can see, the current image size is around 380 MB.
2. Accessing the application logs
To understand container startup times, we'll check the application logs and retrieve the Spring application context startup as a reference.
Execute the commands below to get the application startup time reported by Spring Boot in Amazon EKS:
kubectl logs $(kubectl get pods -n unicorn-store-spring -o json | jq --raw-output '.items[0].metadata.name') -n unicorn-store-spring
kubectl logs $(kubectl get pods -n unicorn-store-spring -o json | jq --raw-output '.items[0].metadata.name') -n unicorn-store-spring | grep "Started StoreApplication"
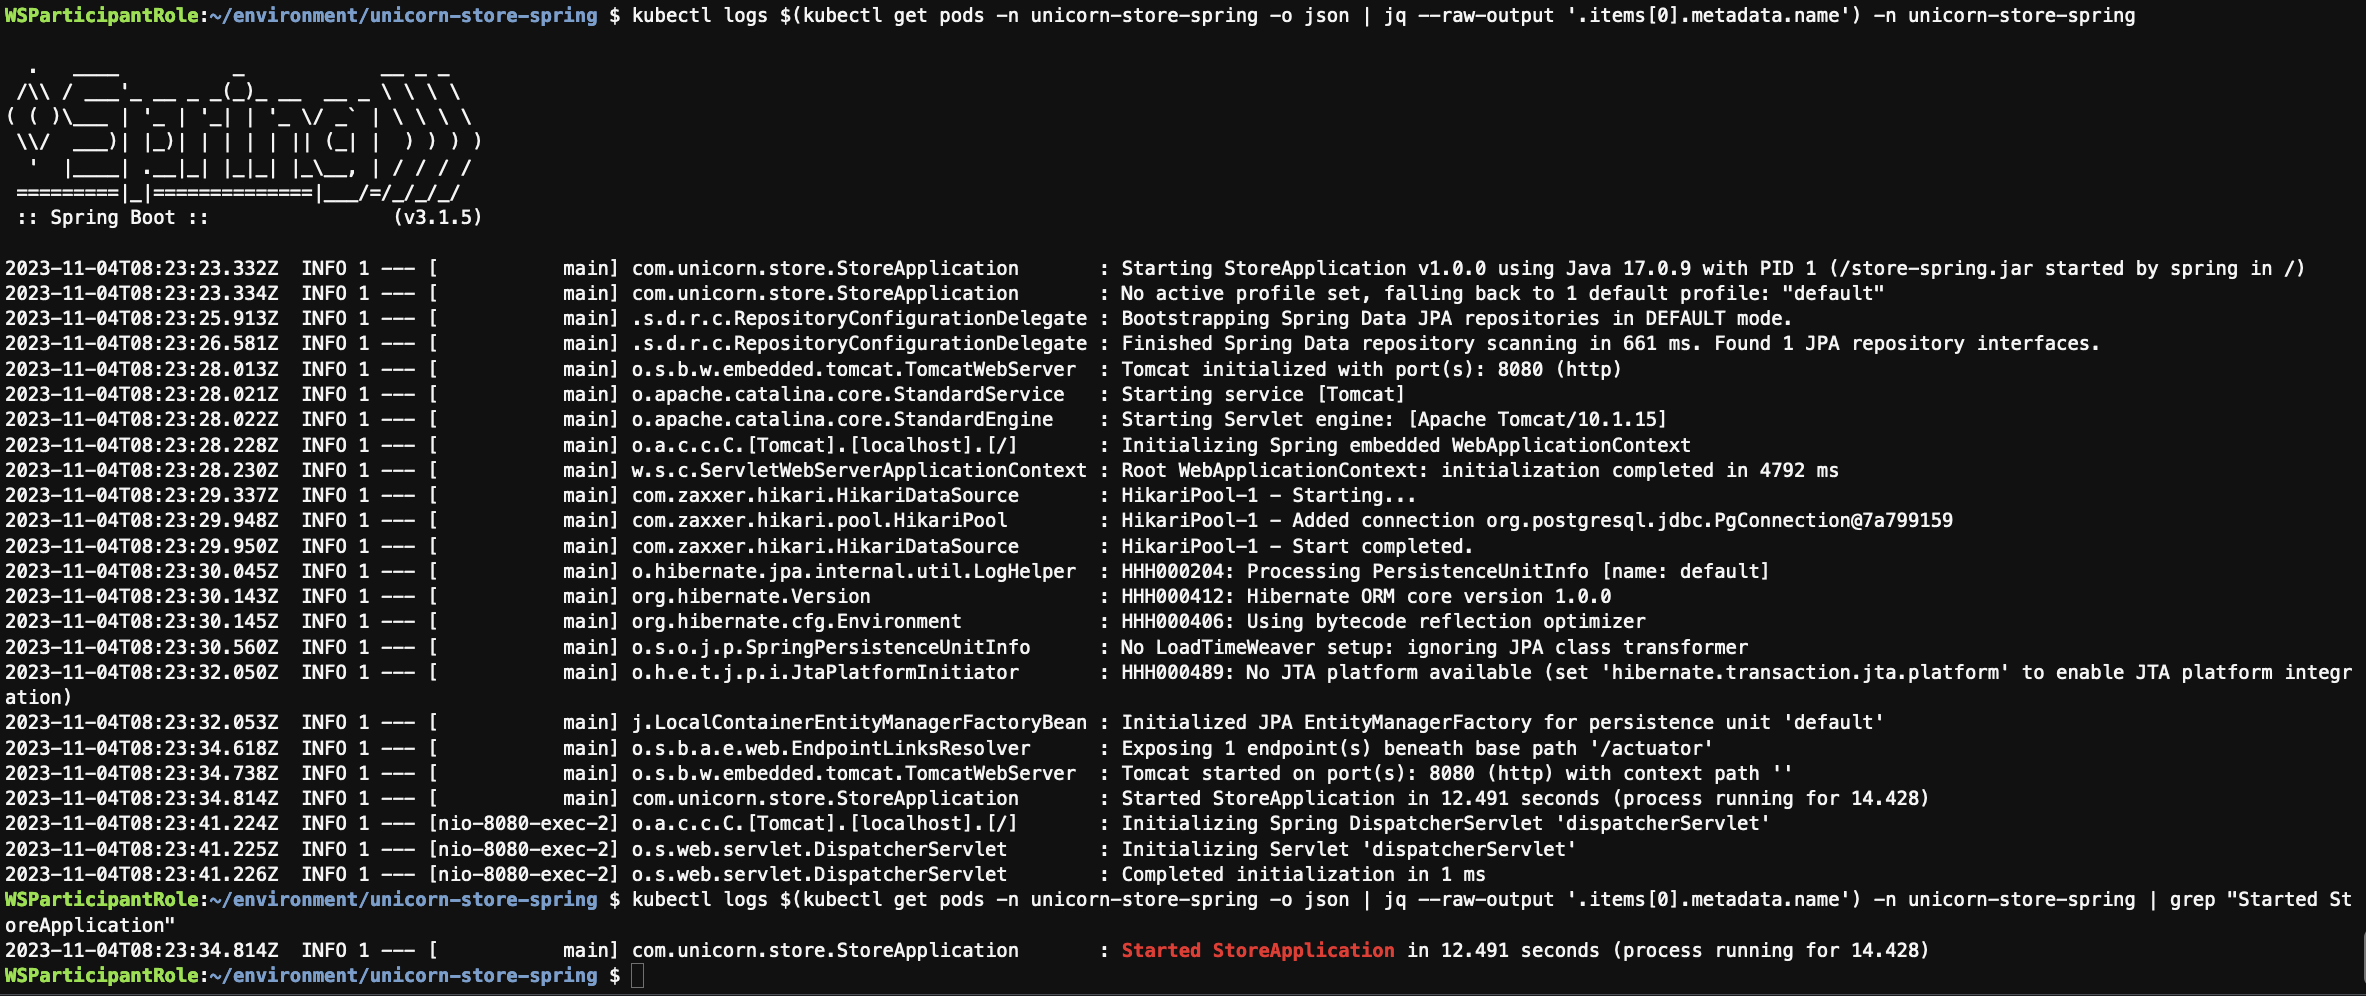
As we can see, the current application startup time is around 12.5 seconds.
Note that image size and application startup times may vary.
Conclusion
In this lab, you learned about the different factors that influence application startup time and how to measure them. You also learned how to access the application logs and identify the image size. In the next lab, you will apply the first optimization technique to accelerate Java applications running on AWS container services.