Adding OpenTelemetry Instrumentation for Distributed Tracing
Objective
This lab shows you how to instrument the application using AWS Distro for OpenTelemetry (ADOT) and deploy the instrumented application in EKS. We'll go through the following steps as part of the instrumentation process:
- Instrument the application code with manual instrumentation in our local environment
- Test the instrumentation locally
- Deploy the ADOT add-on in our EKS cluster
- Deploy the application with the ADOT Collector Side Car Container
- Visualize request tracing in the AWS X-Ray console
Prerequisites
- Securing FastAPI Microservices with Kubernetes Secrets
- Deploying FastAPI and PostgreSQL Microservices to EKS
1. Prepare Your Environment
In the python-fastapi-demo-docker project where your environment variables are sourced, check-out the aws-opentelemetry branch using the following command:
You may receive an error like error: Your local changes to the following files would be overwritten by checkout when running the below command if there are changes made to any of the source files. To fix this, first run the command git stash and then run the below command. After the checkout is finished, run the command git stash pop to reapply the changes.
git checkout aws-opentelemetry
- Fargate
- Managed Node Groups
Next, open the eks/create-adot-add-on-python-fargate.yaml file and replace the sample region with the same region as your EKS cluster. For example:
apiVersion: eksctl.io/v1alpha5
kind: ClusterConfig
metadata:
  name: fargate-quickstart
  region: us-west-2
Next, open the eks/create-adot-add-on-python.yaml file and replace the sample region with the same region as your EKS cluster. For example:
apiVersion: eksctl.io/v1alpha5
kind: ClusterConfig
metadata:
 name: managednode-quickstart
 region: us-west-2
2. Instrument the Application Code with Manual Instrumentation in Local Environment
Otel Instrumentation requires 4 primary steps to get you up and running with OpenTelemetry. Notably, each step is implemented in separate files, including:
- Global Tracer Provider: This is the factory for the tracer. It's responsible for creating and managing tracer objects, which in turn helps you to create spans. You'll find the Global Tracer Provider in the app/tracing.py file.
- Processor: This defines the method of sending the created elements (spans) onwards to the subsequent parts of the system for further processing and exporting. You'll find the configuration for the Processor in the app/tracing.py file.
- Trace Exporter: This component takes care of sending traces to the OTEL Exporter Endpoint and acts as the bridge. You'll find the Trace Exporter in the app/tracing.py file.
- Instrumenting the Application and Database: For the FastAPI application, you'll find it's instrumented in the app/main.py file and the PostgreSQL/SQLAlchemy database in the app/connect.py file.
3. Testing the Instrumentation Locally
We’ll be creating a new and improved multi-architecture image in this lab exercise. Remove the existing multi-architecture container you created:
- Docker
- Finch
docker buildx rm webBuilder
finch images --filter reference=webbuilder
finch rmi webbuilder
To test the tracing locally, build the instrumented application code locally using the following command:
- Docker-compose
- Finch
docker-compose build
finch compose build
docker-compose will use the local image and not the ECR image. In dev set up while doing the changes it is easier to refer to the local image rather than the remote repository image.
Update the .env file by adding the following lines:
# OTLP Specific Configuration
OTEL_EXPORTER_OTLP_ENDPOINT=adotcollector:4317
OTEL_SERVICE_NAME="BookManagemment-App"
Start the application using the following command:
- Docker-compose
- Finch
docker-compose up
finch compose up
Connect to the application and interact with it. This interaction will generate traces that you can check later in Amazon X-Ray.
Use the tabs below to see the steps for the specific environment where you are running this lab.
- AWS Workshop Studio
- Local Computer
Execute the command below in a new VScode terminal to show the URL to connect to FastAPI application:
echo "http://$PUBLIC_IP:8000"
Access this URL using your web browser.
Navigate to http://localhost:8000 in your browser to connect to FastAPI application.
Interact with the application by adding a couple of books.
Then check for traces by opening the X-Ray Tracing page and selecting your AWS Region on the Amazon CloudWatch Console. Click on the "Trace Id" and the "TraceMap" to view traces. For example:
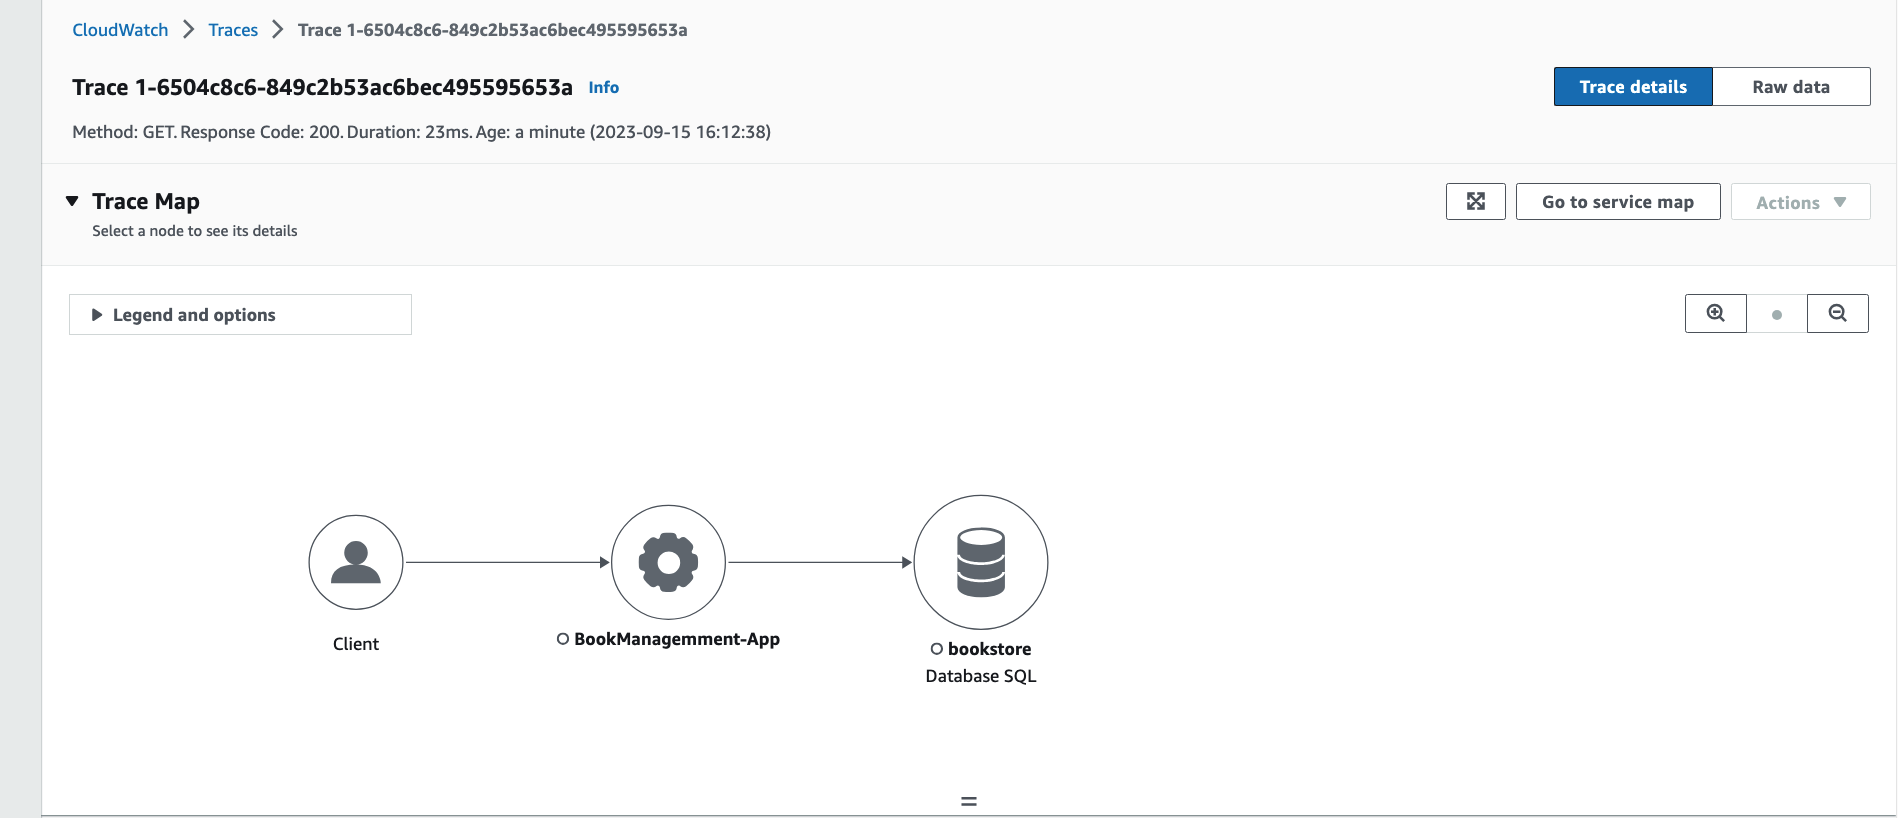
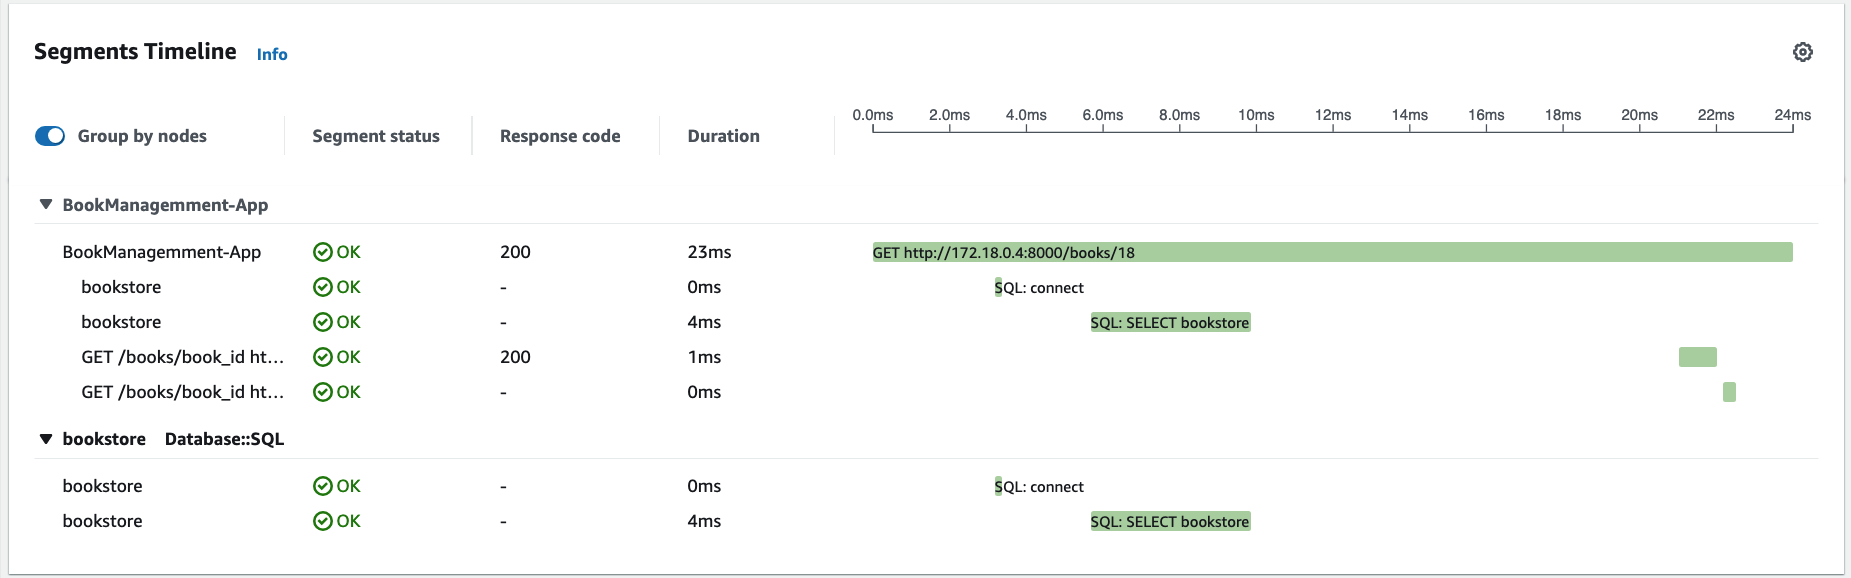
Scroll down to view details of the requests in the trace:
4. Build and Push the Multi-Architecture Container
After running a few requests, we'll now push the image to Amazon ECR.
- Docker
- Finch
First, authenticate the Docker CLI to your Amazon ECR registry using:
aws ecr get-login-password \
--region ${AWS_REGION} | docker login \
--username AWS \
--password-stdin ${AWS_ACCOUNT_ID}.dkr.ecr.${AWS_REGION}.amazonaws.com
Next, create and start new builder instances for the web service by running the following commands:
docker buildx create --name webBuilder
docker buildx use webBuilder
docker buildx inspect --bootstrap
Build and push the images for your web service by running the following commands:
docker buildx use webBuilder
docker buildx build --platform linux/amd64,linux/arm64 -t ${AWS_ACCOUNT_ID}.dkr.ecr.${AWS_REGION}.amazonaws.com/fastapi-microservices:${IMAGE_VERSION} . --push
First, authenticate the Finch CLI to your Amazon ECR registry using:
aws ecr get-login-password \
--region ${AWS_REGION} | finch login \
--username AWS \
--password-stdin ${AWS_ACCOUNT_ID}.dkr.ecr.${AWS_REGION}.amazonaws.com
There is no direct equivalent for buildx using Finch. You can target a set of platforms though.
The finch build command allows targeting different platforms via the --platform flag, similar to buildx. You can build binaries for Linux, macOS, and Windows on AMD64 or ARM architectures. For example: finch build --platform=amd64,arm64 . to target both AMD and ARM architectures.
Using Finch, we can target the desired platform using the following command:
finch build --platform=linux/amd64,linux/arm64 -t ${AWS_ACCOUNT_ID}.dkr.ecr.${AWS_REGION}.amazonaws.com/fastapi-microservices:${IMAGE_VERSION} . push=true
Display your Amazon ECR URI:
echo ${AWS_ACCOUNT_ID}.dkr.ecr.${AWS_REGION}.amazonaws.com/fastapi-microservices:${IMAGE_VERSION}
Replace the sample image in the eks/deploy-app-with-adot-sidecar.yaml file with your Amazon ECR URI. For example:
image: 012345678901.dkr.ecr.us-west-1.amazonaws.com/fastapi-microservices:1.0
5. Deploy the ADOT Add-On
The cert-manager add-on is required for deploying ADOT Add-on. To learn more, see AWS Distro for OpenTelemetry (ADOT) prerequisites and considerations in AWS Otel official documentation.
Deploy the cert-manager add-on in your cluster using the following command:
kubectl apply -f eks/cert-manager.yaml
It would take a minute or two for the pods to deploy successfully. Verify that 'cert-manager' is ready:
kubectl get pod -w -n cert-manager
The expected output should look like this:
NAME                                       READY   STATUS    RESTARTS   AGE
cert-manager-1234567890-abcde              1/1     Running   0          12s
cert-manager-cainjector-abcdef0123-45678   1/1     Running   0          12s
cert-manager-webhook-021345abcd-ef678      1/1     Running   0          12s
Run the following command to install the EKS ADOT add-on:
- Fargate
- Managed Node Groups
eksctl create addon -f eks/create-adot-add-on-python-fargate.yaml
eksctl create addon -f eks/create-adot-add-on-python.yaml
Create the OpenTelemetryCollector Custom Resource Definition (CRD)
Now we'll create the OpenTelemetryCollector CRD object, which contains the configuration required for deploying the OTel Collector as a sidecar container.
First, replace the sample region in the eks/opentelemetrycollector.yaml with the same region as your EKS cluster.
Next, run the following command to create the CRD:
kubectl apply -f eks/opentelemetrycollector.yaml
Verify the ADOT Collector IAM Roles Service Account (IRSA)
The IRSA for ADOT provides the ADOT collector with "write" permissions to AWS X-Ray. The ADOT collector was configured by eksctl when you created your cluster. You can verify that the ADOT collector service account is configured using the following command:
kubectl describe serviceaccount -n my-cool-app adot-collector
The expected output should look like this:
Name:                adot-collector
Namespace:           my-cool-app
Labels:              app.kubernetes.io/managed-by=eksctl
                     aws-usage=application
Annotations:         eks.amazonaws.com/role-arn: arn:aws:iam::xxxxxx:role/eksctl-managednode-quickstart-addon-iamservi-Role1-1N6RG936O0AC2
Image pull secrets:  <none>
Mountable secrets:   <none>
Tokens:              <none>
Events:              <none>
6. Deploy the Application with the ADOT Collector Side Car Container
To deploy the add-on with the ADOT side car container, we'll use the sidecar.opentelemetry.io/inject: "true" annotation in our app deployment's pod specification.
First, let's do a little clean up to remove redundant resources. We'll be redeploying these resources with a few additional modifications. Run the following command to delete FastAPI resources:
kubectl delete -f eks/deploy-app-python.yaml
Make sure not to take any additional steps to delete fastapi-secret secret or fastapi-postgres database resources you created in previous lab exercises, as these are required for subsequent steps.
Deploy the new FastAPI application resources using the following command:
kubectl apply -f eks/deploy-app-with-adot-sidecar.yaml
The expected output should look like this:
service/fastapi-service created
deployment.apps/fastapi-deployment created
ingress.networking.k8s.io/fastapi-ingress created
Run the following command to get the ALB URL:
kubectl get ingress -n my-cool-app
The expected output should look like this:
NAME              CLASS    HOSTS   ADDRESS                                                                  PORTS   AGE

fastapi-ingress   <none>   *       k8s-mycoolap-fastapii-0114c40e9c-507298630.us-west-1.elb.amazonaws.com   80      2m53s
Open a web browser and enter the ADDRESS from the previous step to access the web application. For example, http://k8s-mycoolap-fastapii-0114c40e9c-507298630.us-west-1.elb.amazonaws.com/. Note that ALB may take a few seconds to be fully provisioned and Active.
Then, interact with the application by adding new books.
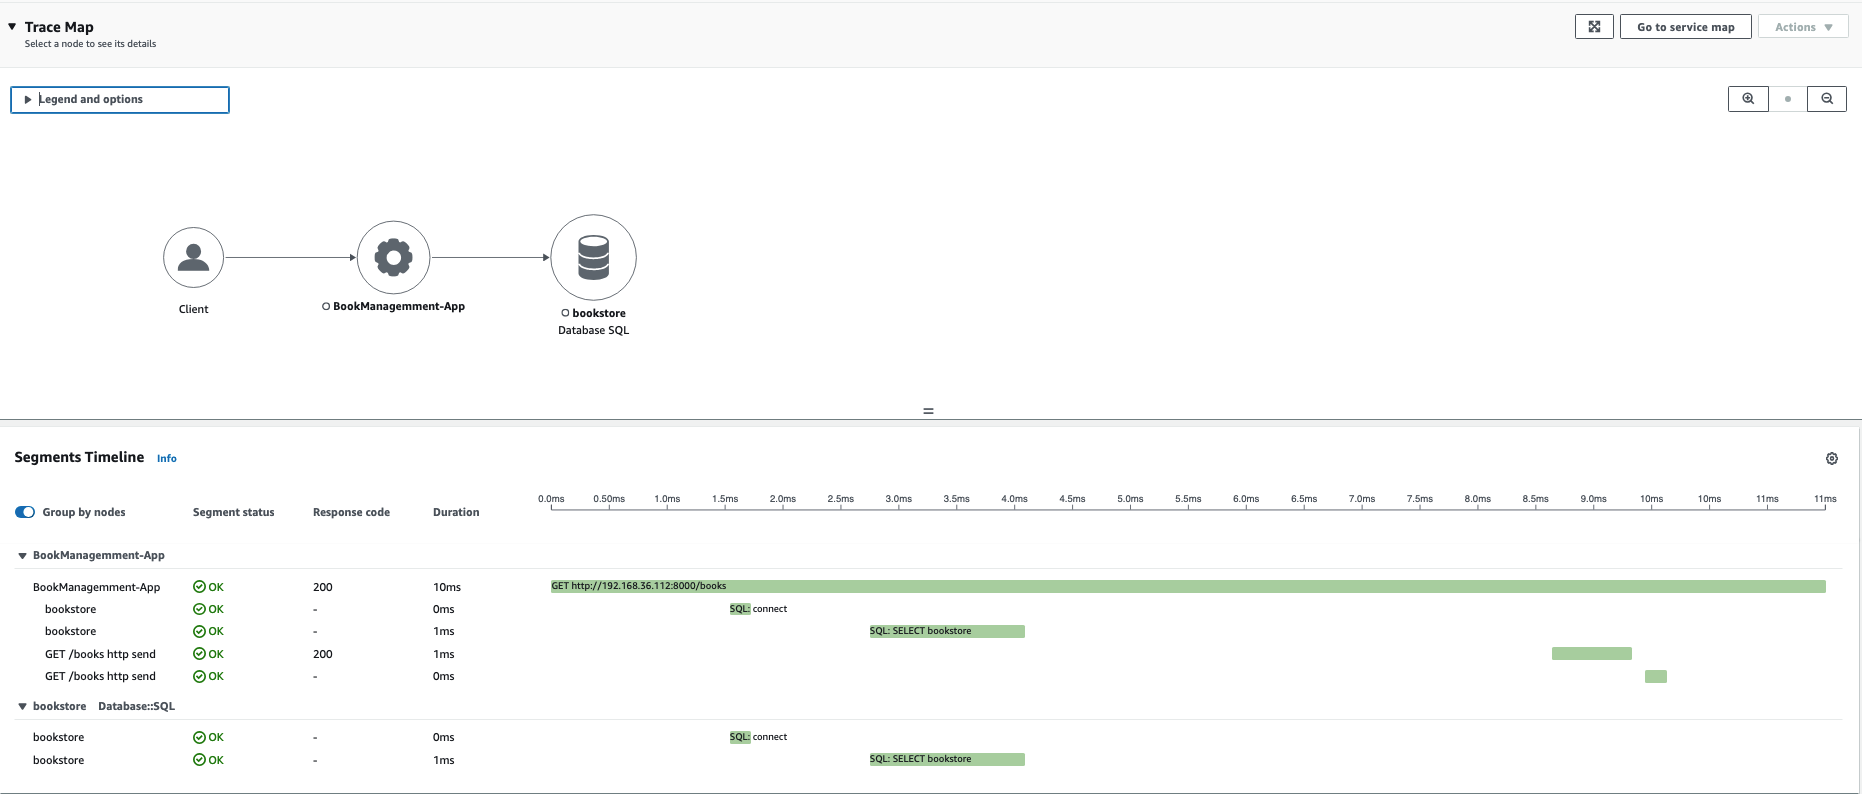
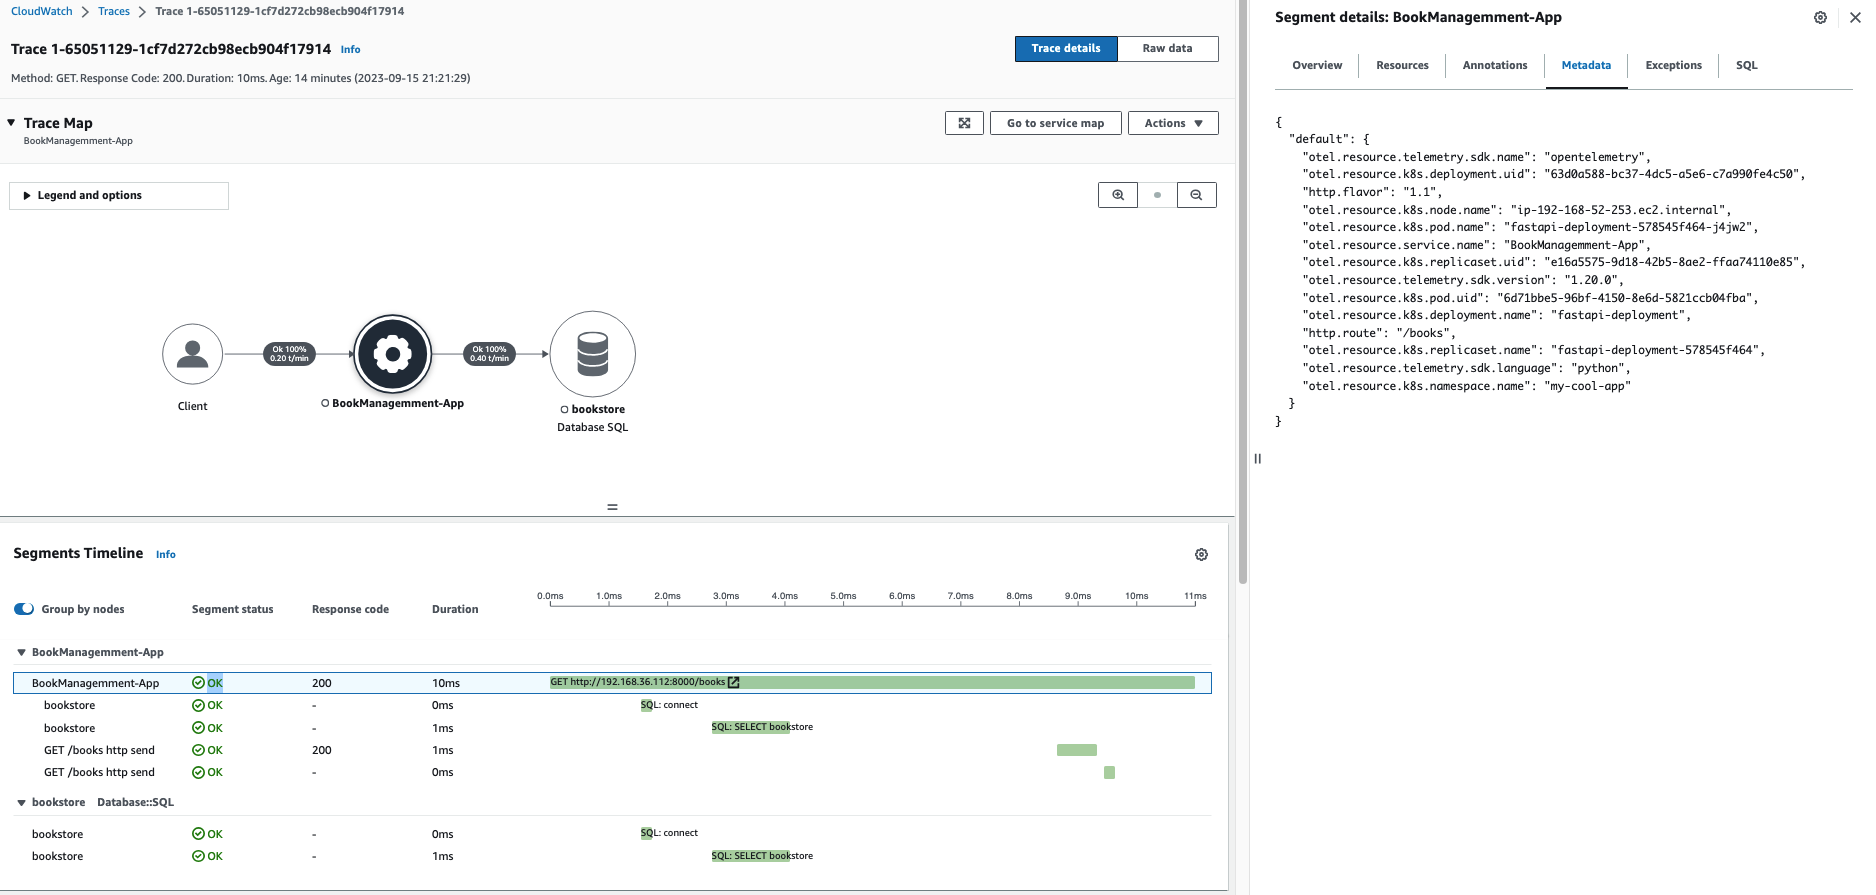
Last, check for traces by opening the X-Ray Tracing page and selecting your AWS Region on the Amazon CloudWatch Console. Check for traces in AWS Cloudwatch Console -> X-Ray -> Traces. For example:
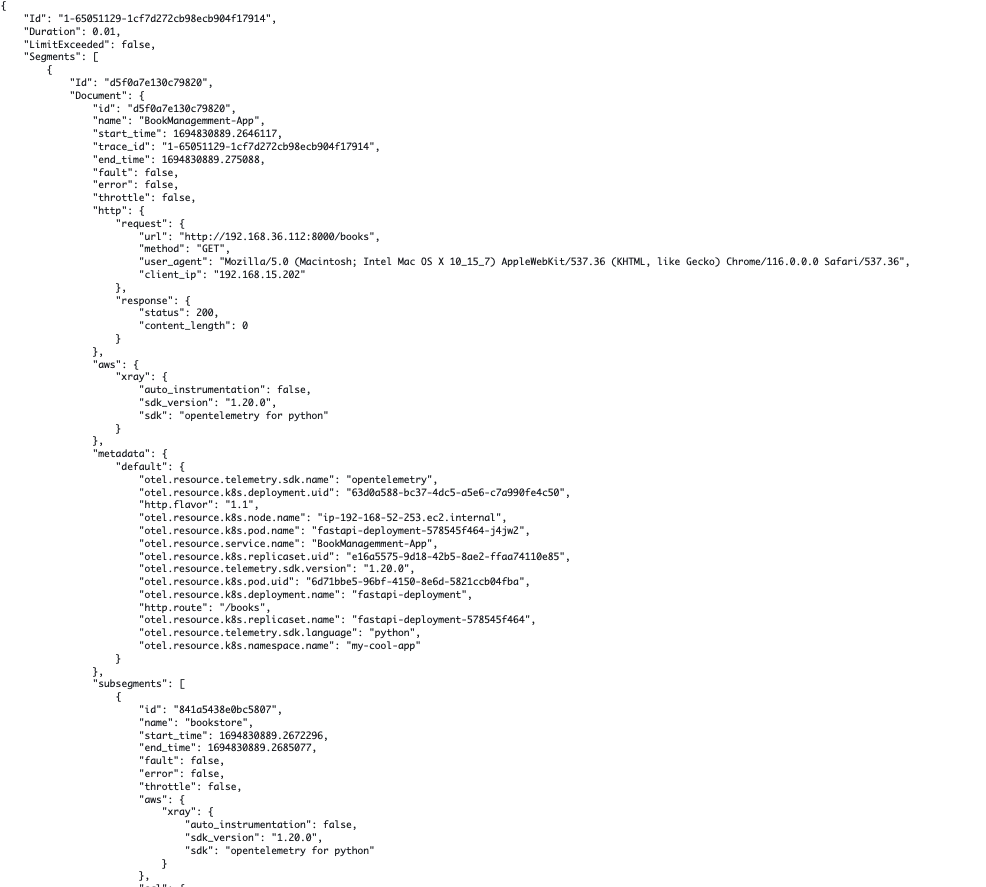
We've used 'resourcedetection' in eks/opentelemetrycollector.yaml in the OpenTelemetryCollector CRD to enrich the trace with Kubernetes-specific metadata. You can see the metadata in raw traces by selecting the application. For example:
You can filter for traces by creating queries in a time duration. To learn more, see Using filter expressions in AWS X-Ray documentation.
Clean Up Resources
To clean up all resources created in this lab exercise and the workshop up to this point, run the following commands.
- Fargate
- Managed Node Groups
cd /home/ec2-user/environment/python-fastapi-demo-docker
kubectl delete -f eks/deploy-db-python-fargate.yaml
kubectl delete -f eks/deploy-app-with-adot-sidecar.yaml
kubectl delete -f eks/opentelemetrycollector.yaml
eksctl delete iamserviceaccount --name adot-collector --namespace my-cool-app --cluster fargate-quickstart
eksctl delete addon -f eks/create-adot-add-on-python-fargate.yaml
kubectl delete -f eks/cert-manager.yaml
kubectl delete pdb coredns ebs-csi-controller -n kube-system
cd /home/ec2-user/environment/python-fastapi-demo-docker
kubectl delete -f eks/deploy-db-python.yaml
kubectl delete -f eks/deploy-app-with-adot-sidecar.yaml
kubectl delete -f eks/opentelemetrycollector.yaml
eksctl delete iamserviceaccount --name adot-collector --namespace my-cool-app --cluster managednode-quickstart
eksctl delete addon --name adot --cluster managednode-quickstart
kubectl delete -f eks/cert-manager.yaml
kubectl delete pdb coredns ebs-csi-controller -n kube-system